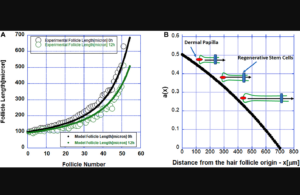
Figure 3: (A) Simulations of the reaction-diffusion model (solid lines) and measured follicle length (solid circles). (B) The function a(x) describing the pro-survival factor released by the regenerative stem cell pool. The inset shows a schematic of a hair follicle regressing slower as it gets shorter and closer to higher values of the pro-survival factor modeled with the function a(x) and released by the regenerative stem cells.

Apoptotic Cells May Drive Cell Death in Hair Follicles During Regression Cycle

“Revealing the stem cell niche self-renewal dynamics is important not only for understanding tissue homeostasis but also for understanding the initiation of cancer [7].” BUFFALO, NY- October 23, 2023 –… read more